 Pushchino 22-Meter Dish
|
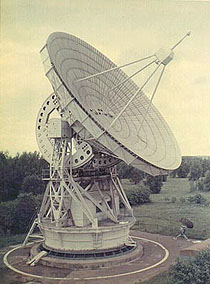
 130-Meter Pulkovo Radio Telescope (in background)
|
|
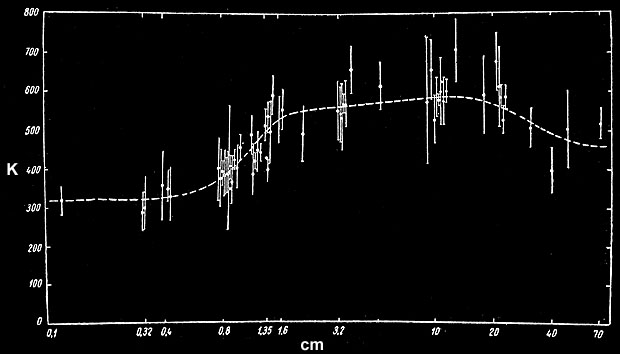
To prove the hot-surface/cold-atmosphere model, astronomers looked for signs of limb darkening, a decrease in radio brightness at the edge of the planet's disk where the atmosphere is thicker.
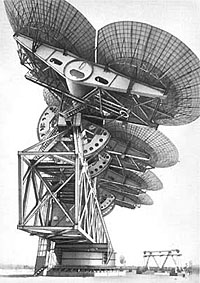
During close orbital approach in October and November 1962, D.V. Korol'kov, Iu.N. Pariiskii and S.E. Khaikin performed the first such test, They observing limb darkening at 3.02 cm wavelength, with the 130-meter knife-edge-resolution telescope at Pulkovo Observatory, and advocated a hot-surface model. Seen above, the telescope is the long fence-like antenna (not the small dish in the foreground), a precursor to Korol'lov's massive 600-meter telescope (RATAN-600). A month later, the Mariner-2 spacecraft detected limb darkening at 1.9 cm, during its historic planetary flyby. However, Caltech's interferometry experiment at 10 cm detected limb brightening. A more conclusive experiment came in 1964, in an American/Soviet collaboration. B.G. Clark and A.D. Kuz'min, using interferometry with two 26-meter dishes at Owens Valley Observatory, demonstrated that emissions from the edges of Venus were partially polarized. This could not result from an isotropic gaseous source. It was strong evidence that the radiation was emitted from the edge of a hard surface. The first measurement of the radius of Venus was calculated in their experiment, giving an value of 6057 ± 55 km. Later more accurate radar measurements of radius were made, in the USSR and USA. After Venera-4 analyzed the chemistry of the atmosphere, Kuz'min recalculated the temperature estimates from radio emission, correcting the 600° K to 700±100° K. Later direct measurements by Venera landers found a surface temperature of about 735° K. Venera-4's discovery, that the atmosphere was almost pure carbon dioxide at high pressure, finally explained the unusual radio spectrum of Venus. Earth-Based Active RadarDuring its 1961 inferior conjunction, four sites successfully probed Venus with radar. The spreading of frequencies, by the Doppler effect, gave the first indications of the rotational period of Venus. More sophisticated radar later provided images of the surface. |
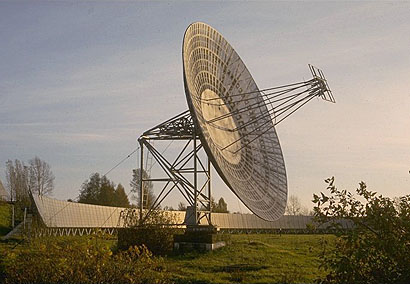
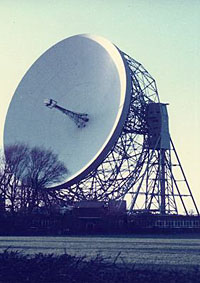 Jodrell Bank (UK)
|
 Evpatoriia (USSR)
|
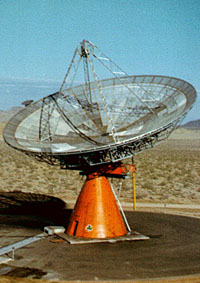 Goldstone (USA)
|
|
The most powerful radar facilities in the world were required to reach Venus. Britain's 76-meter radio telescope at Jodrell Bank was built in 1957.
The Soviet Union's
Pluton deep-space telemetry system
at Evpatoriia was built in 1960 and had three ADU-1000 antennas, one transmitter and two receivers, each consisting of a phased array of eight 16-meter dishes.
JPL's 26-meter Venus antenna at Goldstone was built in 1960.
Another American 26-meter dish was MIT's Millstone Hill.
The team at Evpatoriia included V.A. Kotel'nikov and O.N. Rzhiga. Radar experiments used 39 cm, the same wavelength used to transmit telecommands to spacecraft. The transmitting antenna initially output 10 kilowatts continuous power, upgraded to 40 and then 80 kW before the Venera-2 mission in 1965. In pulsed mode, a focused beam was produced with a peak radiant intensity of 250 megawatts per steradian. The total power reaching the surface of Venus was 15 watts. In 1961, the receiver was an uncooled parametric amplifier, and the results were hampled by noise. By 1962, the sensitivity was increased six times, by using a liquid helium cooled ruby MASER. Cryogenic cooling reduces the thermal noise of the pre-amplifier. The radar receiver was installed in the Pluton transmitter antenna; but after 1964, the radar system was operated in a bistatic mode, using one of the more sensitive Pluton receivers a few kilometers from the transmitter. The results from these studies indicated an unusually slow rotation rate of 200 to 400 days, but the retrograde direction of the rotation was not detected. The Soviet experiment detected two Doppler spreads, one equivalent to an 11 day rotation and the other equivalent to > 100 days. During the 1962 conjunction, Goldstone and Evpatoriia results narrowed the rotation to 250±40 days, and the retrograde direction of the rotation was detected. By 1964, the 305-meter radio telescope in Arecibo was operational. The best results that year were 230±25 days (Evpatoriia), 249±6 days (Goldstone), and 247±5 days (Arecibo). The modern estimate of Venus' rotational period is 243.0187 days. It is close to lock step with its synodic cycle, so Venus almost shows the same face toward the Earth at each inferior conjunction. Early radar studies also refined our knowledge of the planets' orbits and the distance of the Earth from the Sun. In 1961, the position of Venus was only known to within a hundred thousand kilometers. Planetary radar and spacecraft ranging measurements vastly improved this ephemeris data. |
 Chirp Signal
|
 Range Dopper Scheme
|
|
Radar "pings" a surface with an impulse of microwaves, but it is difficult to actually generate a powerful sharp spike of radio emission.
A better solution is to transform the impulse into a "chirp" signal before transmitting it.
The return echo can be frequency analyzed to measure the Doppler shifts, and an inverse chirp transform can recreate the echo that would have resulted from an impulse.
More sophisticated systems transmit a continuous signal with changing patterns of frequency or phase.
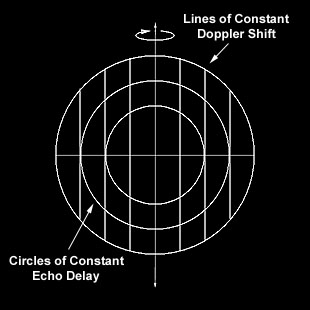
Images of Venus were produced by a technique called range-doppler radar. Since the planet is a sphere, the reflected signal first returns from the center of its face. By separating the echo by delay, the reflections from different concentric rings can be distinguished. Venus is also rotating, which means the right half of its face is moving toward us and the left half is moving away. By separating the echo by doppler-effect frequency shift, the reflections from different vertical bands can be distinguished. North-South ambiguity is resolved by spatial separation, using a large antenna or interferometry between two antennas. |
 1967 Hayford Antenna (MIT)
|
 1972 Goldstone Antennas (JPL)
|
 Pioneer-12
150 km-Res Altimetry |
 Venera-15,16
1 km-Res Imaging |
 Magellan
0.1 km-Res Imaging |
 Venera-15
|
 Venera-15
|
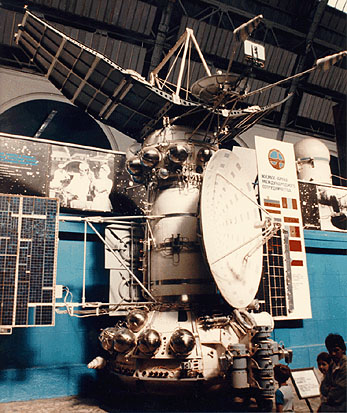
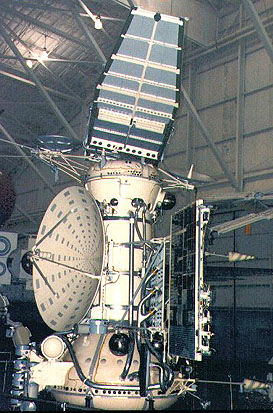
The 4000 kg (without fuel) spacecrafts were based on the standard second-generation Mars/Venus bus, with a specialized section made up of the radar antennas and a pressurized instrument compartment.
The central cylindrical section was a meter longer than standard, to contain the 1300 kg of propellant needed to decelerate and enter orbit.
An extra set of solar panels (not seen above) increased power production by 70 percent.
The enlarged 2.6 meter parabolic telemetry antenna used a new 5 cm band telemetry system, built by OKB-MEI. It could transfer 100 kilobits/sec to the
70 meter receiver at Evpatoriia or the 64-meter receiver at Bear Lakes, even when Venus was at 260 million km distance.
In addition to the radar mission, the Venusian atmosphere would also be probed by an infrared Fourier spectrometer, designed by V.I. Moroz. Cosmic-ray and solar-wind experiments, built at the Moscow University's Institute of Nuclear Physics, have been included on every Soviet spacecraft since Venera-1.
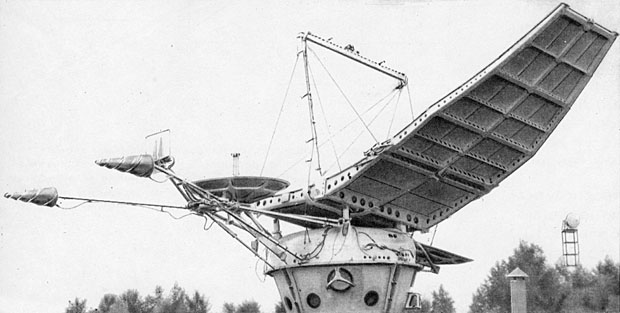
Venera-15 Radar Antennas The radar systems were designed by O.N. Rzhiga's team at IRE, The Institute of Radio Engineering and Electronics. The 1-meter parabolic altimeter antenna was pointed parallel to the axis of the spacecraft. The synthetic aperture radar antenna was a 6 × 1.4 meter parabolic cylinder, and it was angled at 10° from the spacecraft axis. The antennas were alternately switched to an 80-watt traveling wave tube oscillator, transmitting on 8-centimeter wavelength. Rather than pulse or chirp modulation, Venera used a continuous transmission modulated by a coded sequence of 180° phase shifts. |
 Gathering Radar Looks
|
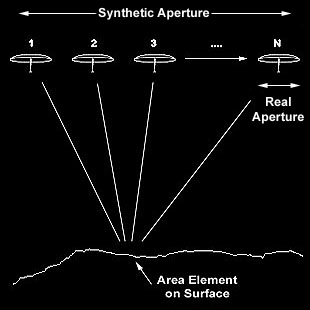 Aperture Synthesis
|
|
The synthetic aperature radar (SAR) performed a series of radar looks, illuminating a spot on the surface for 3.9 milliseconds with a beam of microwaves. During this interval, the beam was modulated by 20 cycles of 127 phase shifts, and the reflected signal was digitized into 2540 complex numbers (4 bits real, 4 bits imaginary). Recording phase and magnitude information, these radar looks were sometimes called "radio holograms".
A radar look was taken every 0.3 seconds and stored in a RAM memory buffer. To keep up with this data rate, recording alternated between two onboard tape recorders.
On Earth, a 2540-byte radar look was analyzed by computer. Digital filters separated the signal into time delays, dividing the radar spot into 127 ranges across the track of the radar beam. Fast Fourier transforms separated doppler shifts caused by the spacecraft motion, dividing the spot into 31 ranges along the track. Resolution was greatly increased by properly processing the signal over the 3.9 millisecond interval, as the moving spacecraft swept out a 70-meter virtual antenna. This processing is called coherent, because operating on complex values can simulate wave interference effects. The final result from processing a radar look was a 31 × 127 pixel image.
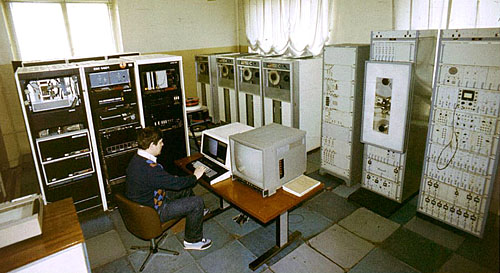
Computer System For Processing Venera Radar Data 3200 radar images from an orbital pass were combined into a survey strip of 195 × 10000 pixels. Typically 6 to 14 images would overlap at each element on the surface. Now only the real-valued image magnitudes were being averaged together, not coherent combination, and this served to reduce speckle noise. Speckling was a natural result of viewing the surface with coherent microwave radiation, just as objects illuminated by laser light appear speckled and grainy. Processing was performed at Rzhiga's institute using a pair of SM-4 minicomputers and a 20-mips special Fourier Transform Processor (SPF-SM). The SPF-SM was developed at the Institute of Electronic Control Computers, under the leadership of Iu.N. Alexandrov. It appears to be closely related to their PS-2000 super computer, consisting of an SM host processor (a Soviet variant of the PDP-11) and a SIMD parallel math co-processor. PS-2000 co-processors could be configured for up to 200 mips.
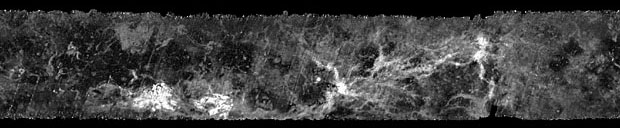
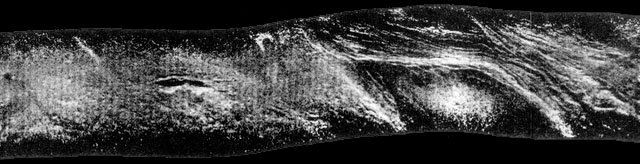 Section of Venera-15 SAR Survey Strip
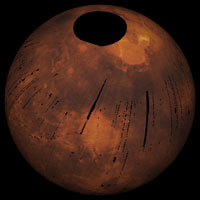
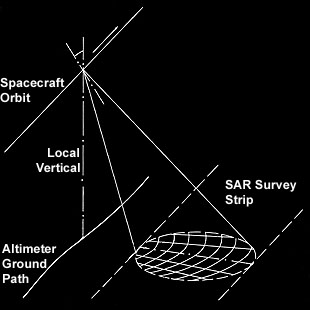
The Venera satellites were placed in elliptical polar orbits, with a minimum altitude of 1000 km above 62° N latitude. During close approach, 16 minutes were spent gathering data from near the north pole down to about 30° latitude. The survey strips were about 120 km wide and 7500 km long. Later in the 24-hour orbit, the 3200 gathered radar looks were transmitted to Earth, a total of 8.1 megabytes plus altimeter and IR-spectrometer data. The Soviet Union did not have a global deep-space communications network, so the spacecrafts had to maintain a 24-hour orbit, synchronized to be in radio line of sight with Evpatoriia every day. Several course corrections were made to maintain the shape of the orbits. The plane of an orbit remains fixed in space, but Venus rotates 1.48° every 24 hours, allowing the entire polar cap to be scanned during the mission, from November 11 to July 10. Initially the orbital planes of the two spacecraft's orbits was 4° apart. While Venus was out of radio contact behind the Sun, a portion of the surface was not mapped. Later, Venera-16's orbital plane was changed by 20° to scan the missed section.
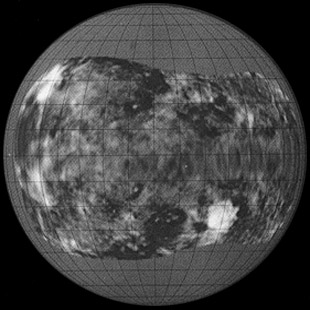
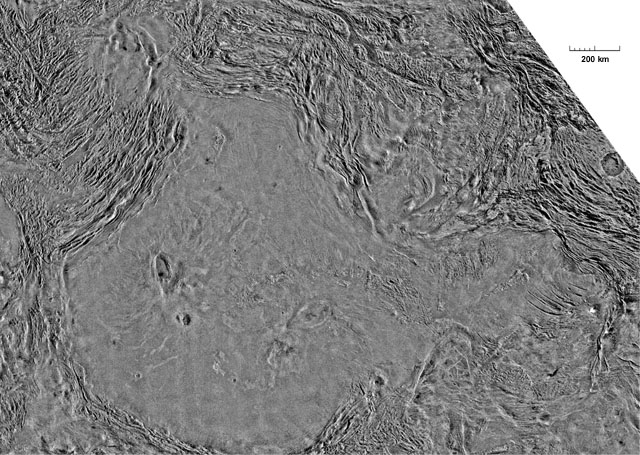 Venera Mosaic of Lakshmi Planum & Maxwell Montes
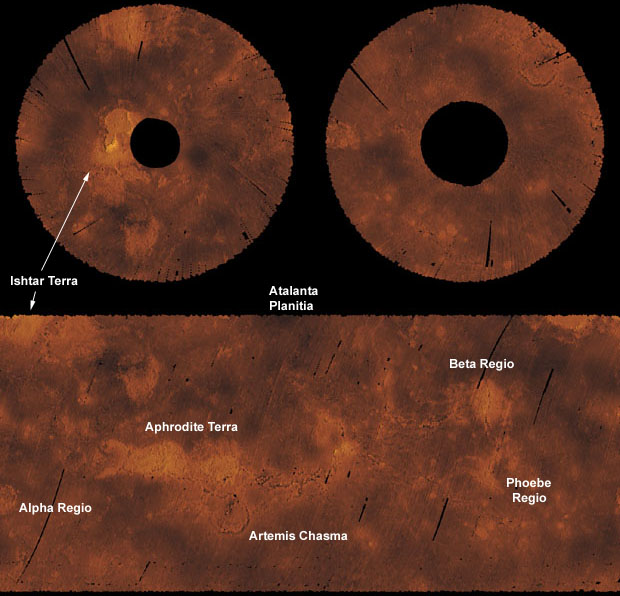
The individual survey strips were joined into mosaics with image processing to form a complete map of the northern cap of the planet. A catalog of 27 mosaics were assembled, each about 4000 to 5000 pixels wide, in Lambert-Gauss conformal projection. The slopes of Maxwell Montes are seen on the upper right, with the giant crater Cleopatra. Maxwell was initially believed to be a volcano. Russian geologists, using Venera-15 images, asserted that it was actually a mountain pushed up by tectonic pressure, with a large meteorite impact crater near its summit. After years of controversy, Magellan images proved them right.
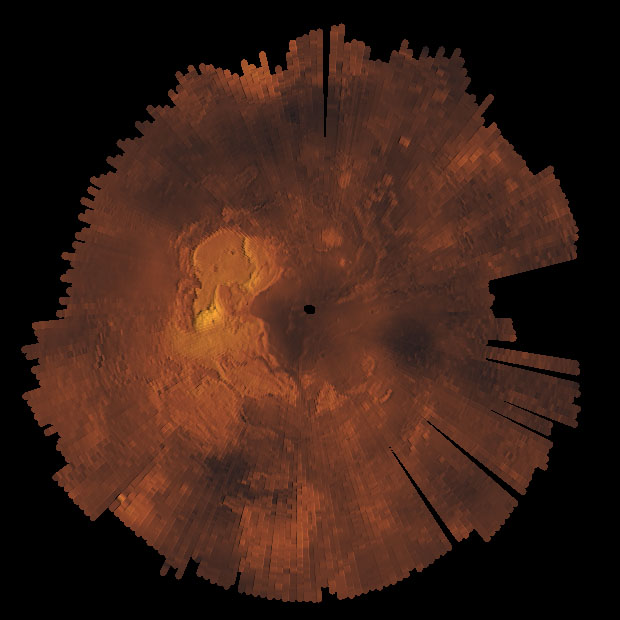 Stereographic Map of Venera-15,16 Altimetry Data
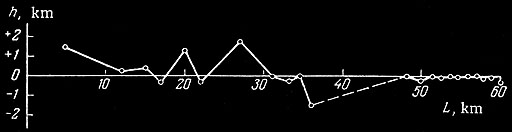
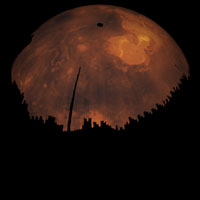
The radar altimeter pointed directly down at the surface beneath the spacecraft and produced an altitude estimate with an accuracy of 50 meters. The footprint of the altimeter beam was about 70×40 km wide on the surface (along track × cross track). For the first few weeks (up to November 28), a low-resolution mode was used, with the 127-element phase modulation. This yielded a long ambiguity distance of 29.3 km. After the orbits of the satellites were accurately determined, the altimeters were switched to high-resolution mode. A 31-element phase modulation was used, with an ambiguity of 7.15 km, and Doppler frequency analysis narrowed the effective footprint to 10×40 km. Over 415,000 altimeter readings were gathered during the lifetime of the mission. This data is displayed above, with some systematic error in orbital data that the author will attempt to correct someday. The high (yellow) mountain to the left of the north pole is Maxwell Montes, a giant volcano and the highest feature on Venus.
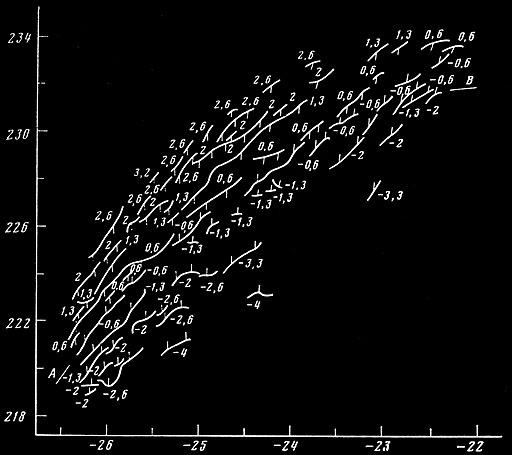
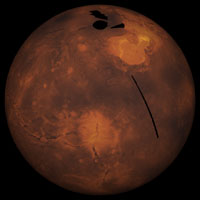
Cartographic Synthesis of Venera Data The combination of altimeter data and radar imaging allowed Russian cartographers and geologists to produce the first maps of Venus that showed its surface with enough detail to accurately analyze the planet's geomorphology. Seen above is the singular structure of Lakshmi Planum, a high plateau of lava surrounded by mountains, including Maxwell Montes on its eastern side. Russian geologist A.A. Pronin proposed that Lakshmi is a giant corona, formed by an upwelling of the underlying mantle of Venus. Brown University geologist J.W. Head, a guest scientist on the Venera mission, proposed an alternative hypothesis, that Lakshmi is formed by a confluence of compression forces in the surrounding crust. |
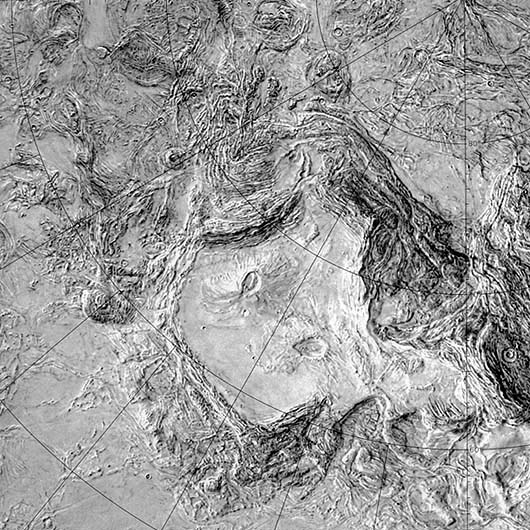
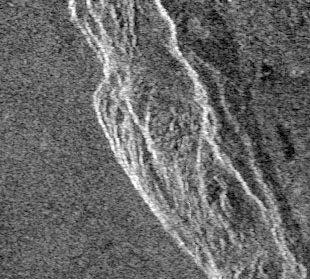
 Venera Image of Volcano, Colette Patera
|
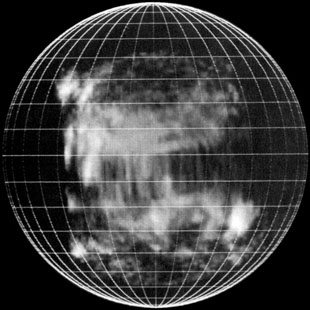
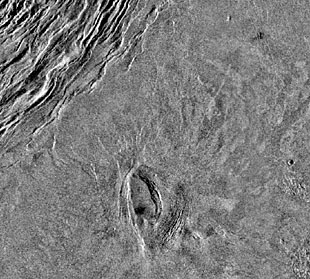
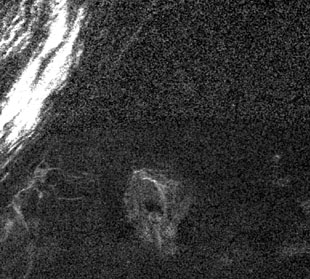 1983 Range-Doppler Image From Arecibo
|
|
The data from Venera-15 & 16 was of unprecedented quality, leading to a new understanding of the geology of Venus.
Range-Doppler imaging was approaching a resolution of 1 or 2 km in the 1980s, comparable to the resolution of the Venera SAR images. But as seen above, resolution is not the only factor in image quality.
The Earth-based technique suffered from strong speckle noise, and the visualization of topographic relief depended on viewing angle and other factors.
Where Arecibo and Venera surveys overlapped, the Venera data proved much more accurate at classifying features.
Volcanoes like Colette on Venus are most often broad and gently sloping, built from basaltic lava of low viscosity, like the shield volcanoes of Hawaii. The high atmospheric pressure may also muffled the explosive pyroclastic release of volcanic gas during eruptions, which might explain the rarity of tall conical volcanos. Altimeter data is particularly useful when large features have undramatic radar relief. |
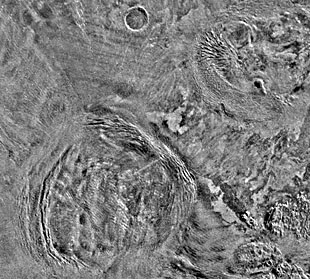 Anahit Corona and Pomona Corona
|
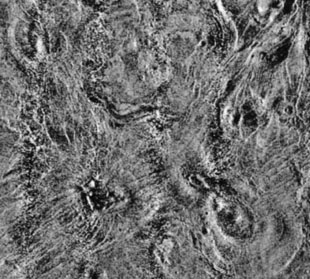 Arachnoids in Bereghinya Planitia
|
|
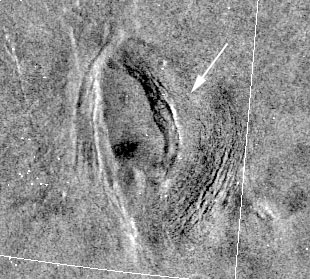
A major discovery from this mission was the existence of coronae, large circles or ovals of concentric rings, which up until then had been mistakenly identified as lava-filled impact craters in range-doppler images and Pioneer altimeter data.
A team headed by V.L. Barsukov and A.T. Bazilevskii were the first to explain these common features on Venus, finding 30 of them within the Venera survey.
The small circular feature in the top center is an actual meteorite impact crater.
Collapsed domes with radial cracks were called arachnoids, because of their spider-like appearance. 80 were discovered by Venera. Coronae, arachnoids and domes were believed to result from hot spots in the underlying mantle. Unlike the Earth, Venus does not seem to have moving tectonic plates. Rather than producing chains of volcanoes, like Hawaii, hot spots on Venus remain stationary and generate volcanic blisters in the planet's crust. |
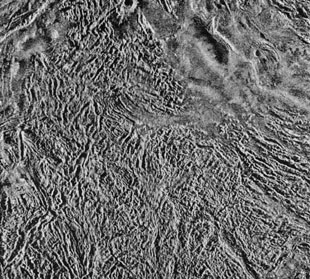 Fortuna Tessera
|
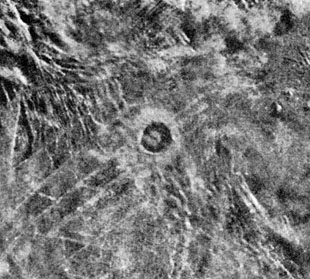 Meteorite Crater, Duncan
|
|
Another discovery of the Venera mission were regions crisscross with ridges and valleys.
Called tessera, they appear to be the oldest regions of the planet's crust, often found partially covered or embayed by later lava flows, as in the upper right on the image above. Tessera make up about 8 percent of the surface of Venus.
Venera's radar images first permitted impact craters to be accurately distinguished from other circular features like coronae. The Russian team counted 150 impact craters in the area surveyed. This was a sparse density of craters, leading to the conclusion that the crust of Venus is only 750 ± 250 million years old. Some believe that Venus was catastrophically resurfaced, forming the tessera landscape, which was later covered by volcanic lava flows. The thick atmosphere of Venus stops small meteorites, but larger objects have enough kinetic energy to punch through to the surface. In the dense atmosphere of Venus, a typical kilometer rock creates a linear explosion, releasing 600 megatons per kilometer along their path. B.A. Ivanov suggested that even if the meteorite burned up before impact, a rock-pulverizing shockwave could still result. He was no doubt mindful of the 1908 Tunguska impact, which flattened trees in Siberia but left no crater. Venera-15's Infrared Fourier SpectrometerThe first long-term survey of the Venusian atmosphere and clouds was performed by the Venera-9 & 10 orbiters in 1975. A battery of IR, UV and Visible spectrometers, polarimeters and cameras probed the planet for several months, their results analyzed by V.A. Krasnopol'skii and L.V. Ksanfomaliti. Three years later, Pioneer-12 added greatly to this inventory of data. It discovered the presence of a polar vortex in the atmosphere, and infrared radiometers found a hot counter-rotating dipole at its center, probably thin spots in the clouds exposing heat from below. |
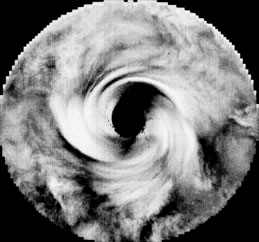 The Polar Vortex (Pioneer-12)
|
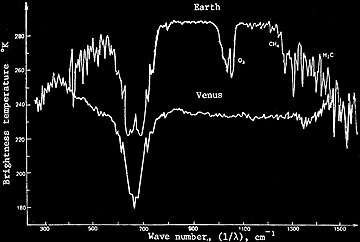 Venera-15 Infrared Spectrum
|
|
The most detailed infrared survey was made by Venera-15's
infrared Fourier spectrometers,
in an experiment headed by V.I. Moroz and Dieter Oertel. The device itself was designed in East Germany. An identical instrument on Venera-16 malfunctioned.
This instrument recorded 256-point spectra from 6 to 35 µm, at 60 points along each radar-survey pass.
The strong 15 µm carbon dioxide band was used to measure temperature profiles of the atmosphere, and the abundance of water vapor and sulphur dioxide were mapped. This provided detailed information about the thermal structure, dynamics and chemical variations in the atmosphere. Moroz discovered that the cold polar collar was composed of larger particles than the upper cloud layer, and a second jet stream was found at a lower latitude. The clouds of Venus were known to contain droplets of sulphuric acid, but Moroz' experiment was the first to actually identify the chemical directly. Seen above, in comparison with the Earth's spectrum, a strong carbon dioxide band is seen, but the oxygen and organic-molecular signatures are absent. This cast further doubt on the remote possibility of living organisms within the clouds. America's Magellan MissionThe Venera-15/16 mission had discovered most of the unique geological features of Venus, but it also raised new questions and refocused scientific thinking. An American radar mission had been planned, but was delayed by funding cuts. In light of Venera's result, the original survey mission at 0.6 km resolution was upgraded to 0.1 km. To save money, a spacecraft was ingeniously assembled, using spare parts from the Galileo mission and other projects.Launched on May 4, 1989, the normal trajectory to Venus in that time required enormous energy to decelerate into orbit. An unusual type-3 trajectory was chosen instead, taking the spacecraft around the Sun before entering orbit, over a year later, on August 10 1990. This also avoided scheduling conflicts with the Galileo mission, which was using a more conventional trajectory to Venus for a gravity assist to Jupiter. Like Pioneer-12, a large solid-fuel engine was used to decelerate the craft. After participating as guests on the Venera mission, American scientists reciprocated by inviting some Soviet investigators on the Magellan mission. Data about Venus and Mars was exchanged under a treaty between the Soviet Union and the state of Rhode Island, and annual joint symposia were begun at The Vernadskii Institute and Brown University.
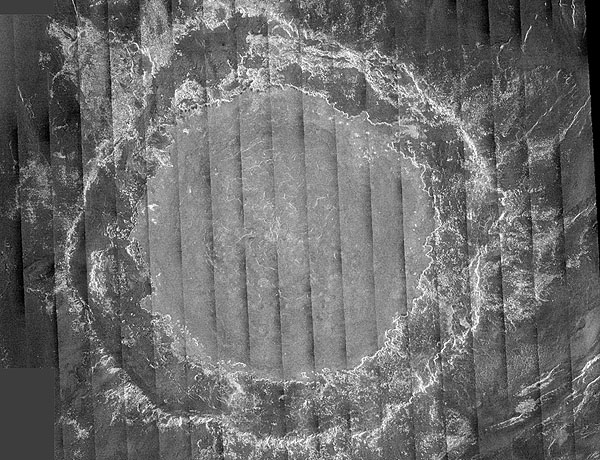
Magellan Image Mosaic of Crater Mead Magellan made a 37-minute survey pass from the north pole to 75° south latitude. Images were transmitted to Earth at 115 - 268.9 kilobits/sec, during 2 hours of playback before the next orbital pass. The individual radar images were synthesized into survey strips of 20 × 17,000 km. SAR resolution varied from 100 to 250 meters depending on spacecraft altitude. As with Venera, the strips were composited into mosaics by image processing. The image above is the impact crater, Mead. This early image demonstrates the mosaic of SAR survey strips, but later reprocessed images are usually seamless. |
 Venera Image of Colette Patera Volcano
|
 Magellan Image of Caldera's Edge
|
|
The images above demonstrate the ten-fold increase in radar resolution over Venera-15 & 16.
The improvement in Magellan's image quality was a result of several factors: lower altitude, improvements in radar technology, larger dynamic range, and increased viewing incidence angles (16.5° - 45.7° versus Venera's 10°).
Another improvement from Magellan was its more complete coverage. From 1990 to 1994, it mapped 98% of the surface of Venus. Consequently, the Magellan survey confirmed that Venus has a unified crust without moving and subducting plates. While Soviet analysis of the Venera survey had found no compelling evidence for plate tectonics, it was still possible that they were seeing just the wrong 25% of the surface. Soviet geologists had begun the long tedious process of classifying the relative age of different types of terrain, by meteorite-crater density, tectonic fracturing of features, and stratigraphic analysis of overlapping lava flows. Magellan's increased resolution and coverage both contributed to this important study, and the hypothesis that tessera landscape is the most ancient type of crust was confirmed.

Altimetry Map of Ishtar Terra Magellan's radar altimeter took over 4.2 million readings, with a resolution of 30 meters and a range ambiguity of 10.2 km. The image above is assembled from Magellan data and the newly recalculated spacecraft ephemeris. Venera data was used to fill in missing sections. Biographies
AcknowledgementsMany image are from NASA and come courtesy of their generous non-commercial usage policy. In particular, many are from the web site of David R. Williams, National Space Science Data Center, nssdc.gsfc.nasa.gov. Images of the Venera-15 spacecraft are courtesy of Andy Salmon and Karl D. Dodenhoff.Special thanks to Aleksandr Bazilevskii, Vladimir Krasnopolskii, Arkadii Kuz'min and Oleg Rzhiga for their comments, and answers to questions and feedback on this page. I would also like to thank Peter Ford and Piotr Masek for their assistance in obtaining Venera and Magellan radar data. |
 A.T. Bazilevskii
 A.D. Kuz'min
 O.N. Rzhiga